| Area | Leader | Farming system |
|---|---|---|
| Siliana Governorate, ElKrib Delegation | INAT | Cereal plains under rainfed conditions |
| Main productions and value chains | Main issues | |
| Cereal production and Olive gardening | Drought, Soil degradation | |
Small Scale Farms
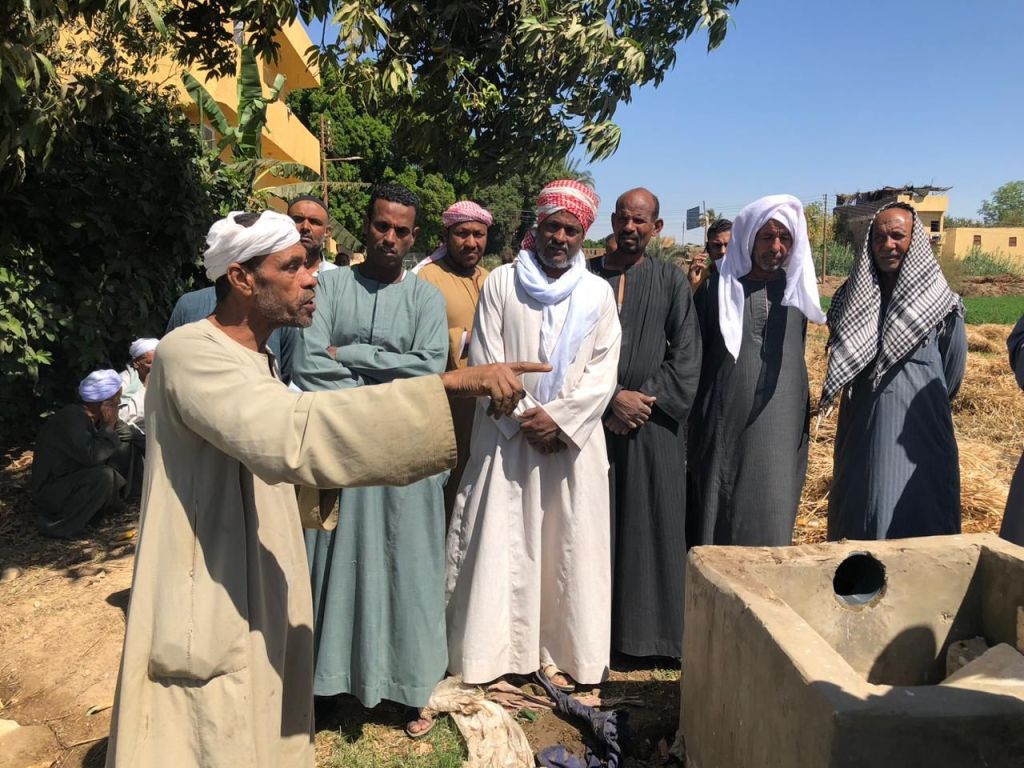
Small Scale farm type focuses primarily on cereal production including durum wheat, barley, and oats. In addition, olive cultivation is very common in this type, along with livestock (small ruminants) activities. The average farm size of 5.1 ha, without access to irrigation. Farmers in this farm type typically do not have off-farm employment, and their education level is mainly secondary. This farm type is the most common farm type in the LL.
Medium Scale Farms
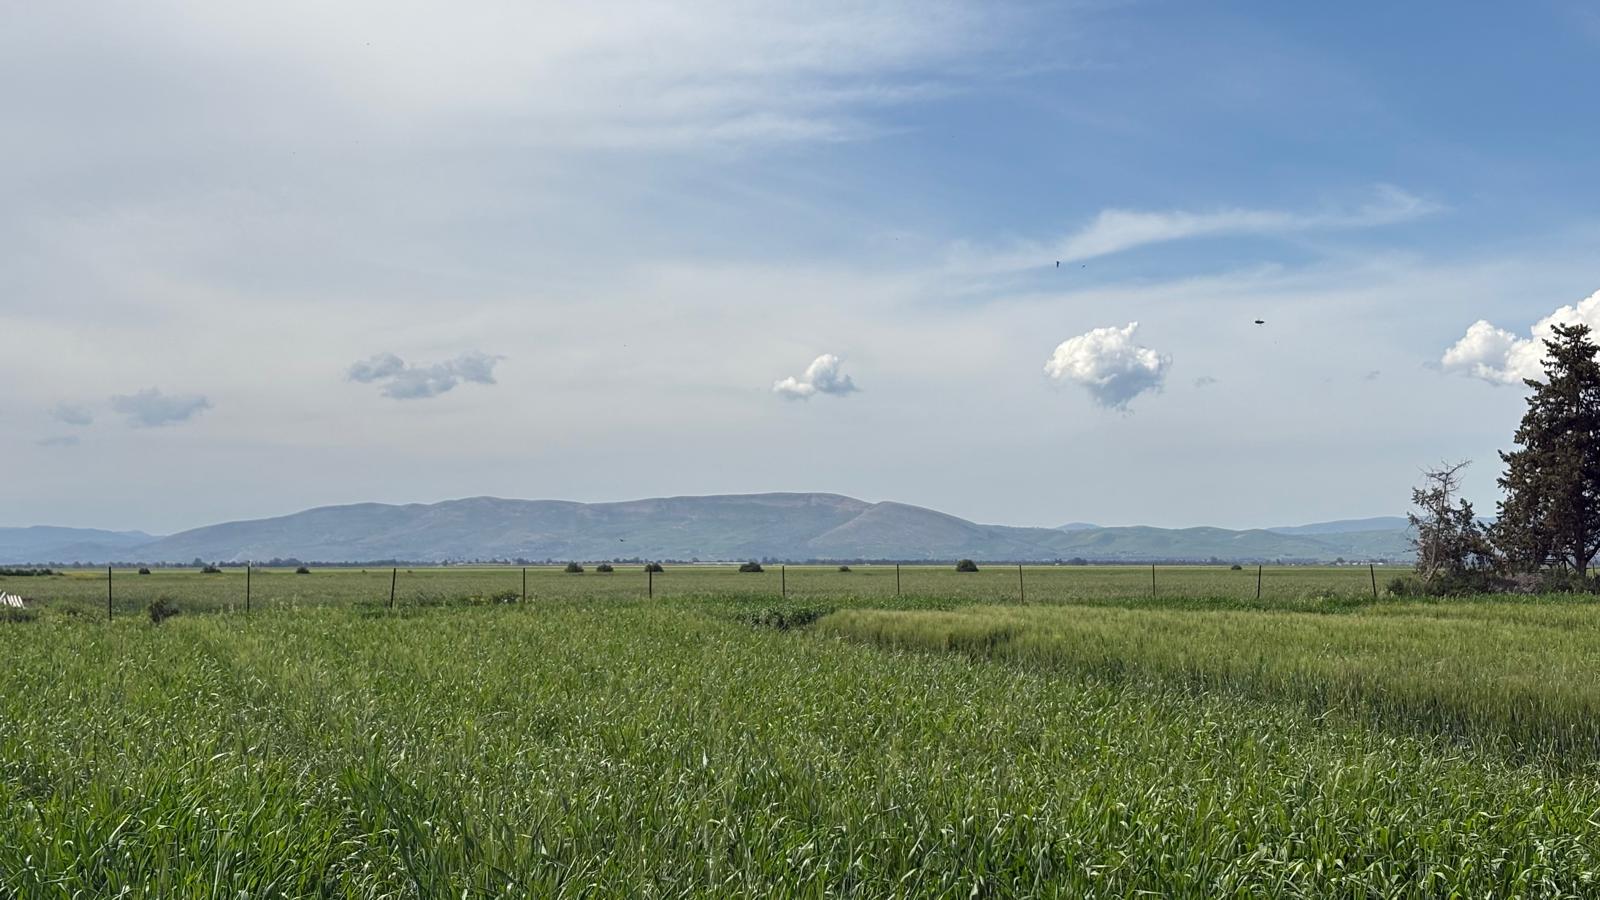
Medium scale farm type has similar characteristics to Small Scale farm type, where the main production orientation is cereals with olive gardening coupled with livestock activities. These agricultural activities are practised together in a larger scale, average of 47 hectares. As small-scale farms; farmers belong to this farm type don't have off-farm employment and their education level is secondary.
Large Scale Farms
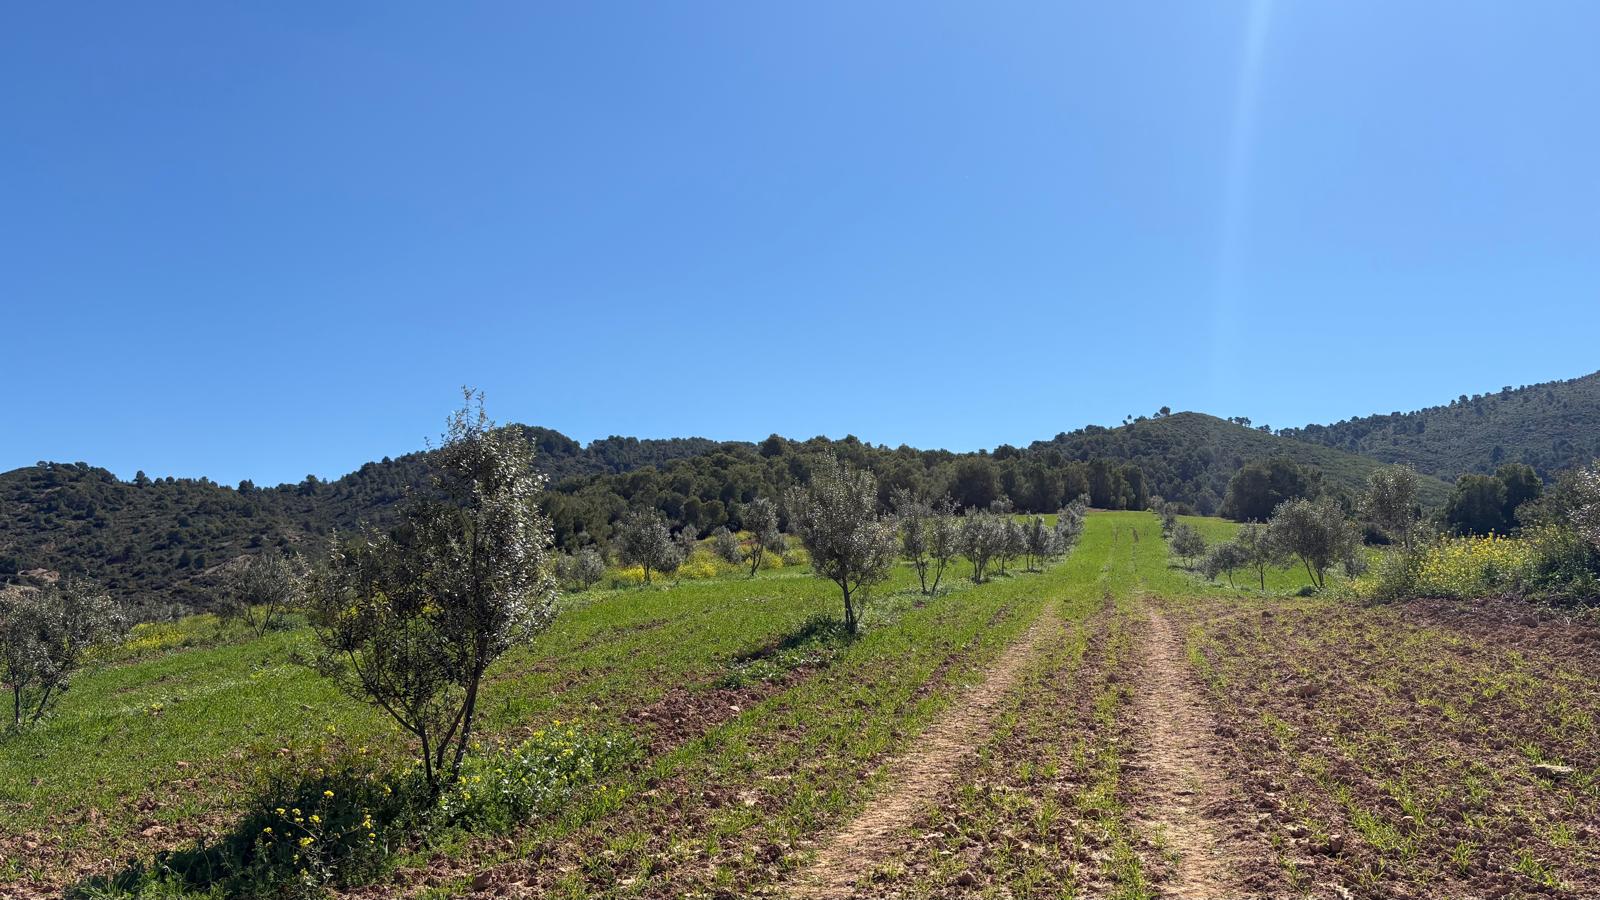
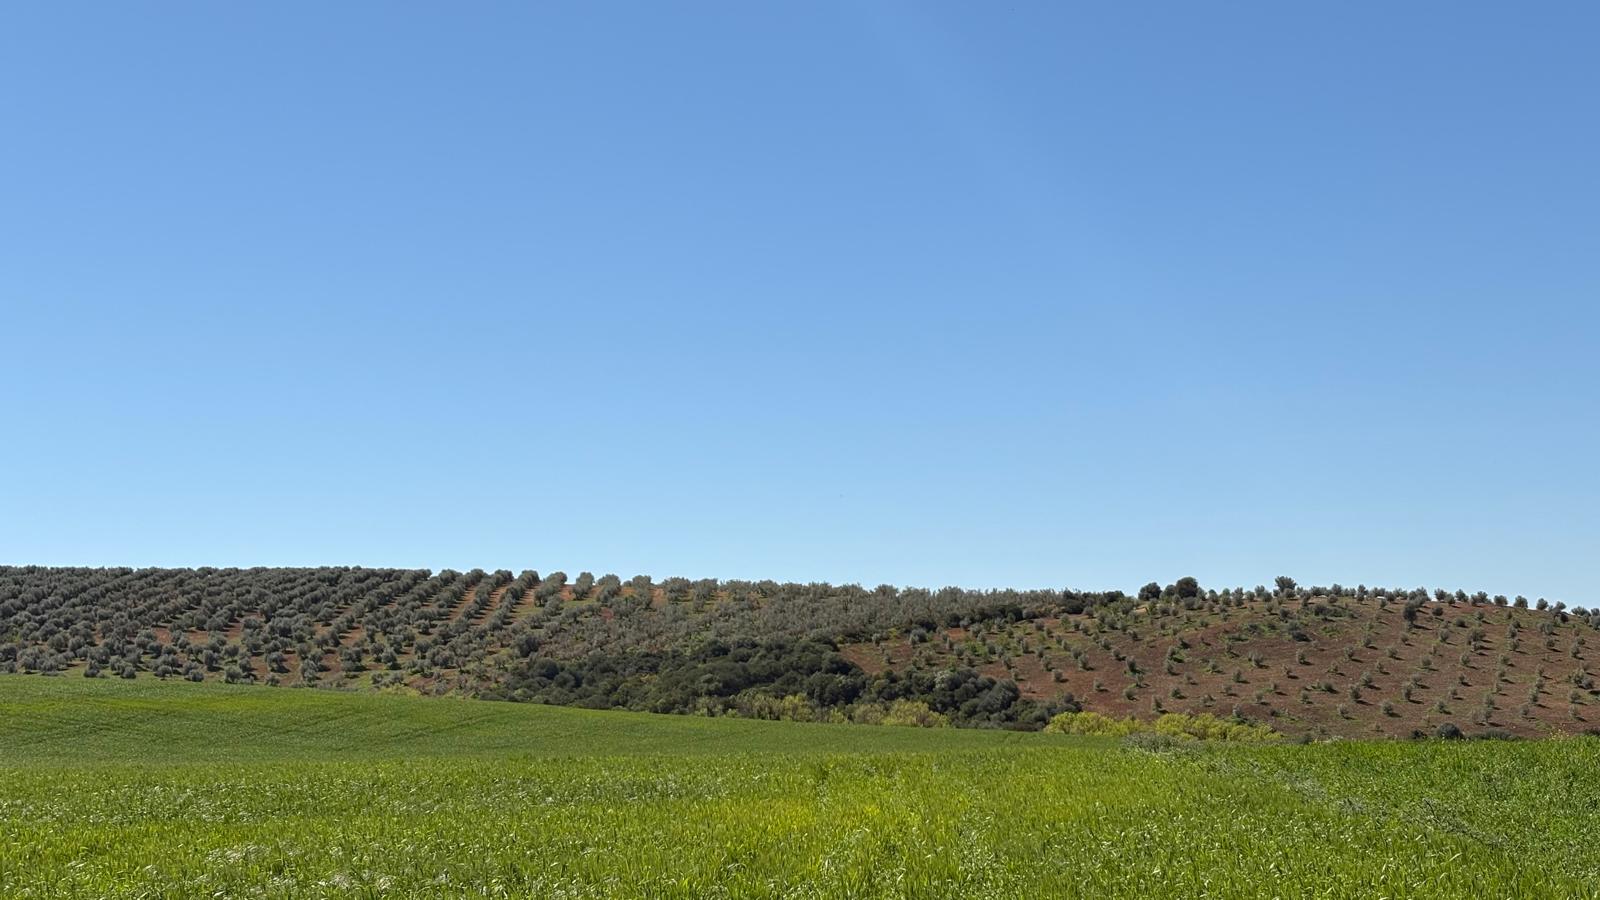
Large-scale farm type represents larger scale agriculture activities based mainly on tree and cereal cultivation, with an average size of 107 hectares. In this farm type farmers do not engage in livestock activities. Large-scale farms also have higher levels of education, with university degrees, as well as non-agricultural professions.
| Name | Forage Mixture |
| Résumé | This AEP introduces a forage mixture into the current production system. A combination of vetch (75%) and oats (25%) replaces traditional forage crops to improve feed quality and enhance drought resilience. |
| Assumptions |
Usual forage species (oat or barley, but only one at a time) will be replaced by a forage mixture of %75 vetch and 25% oat to enhance the nutritional quality of the forage. The forage mixture will be used as cut feed, not grazing. Seeds will be provided by the private sector based on improved varieties. Information from the field: Livestock in the LL is mainly sheep, Farmers also use concentrate. There are problems in maintaining livestock due to the high cost of feed and drought seasons (they can’t cultivate forage crops during the drought seasons). |
| Technical details |
Yield
The yield level will be higher than the existing forage crops which are barley or oat since it’s a mixture of two different crops. Information regarding the yield levels will be obtained from the experiments.
Activities and Labour
Mechanization: Will remain the same as oat or barley.Sowing: Seeder should be calibrated, often need to stop and mix again seeds since it’s not only one species but two. This will cause more time and more labor (1.5 to 2 times more). Tillage: Will remain the same as oat or barley. Weeding: Will remain the same as oat or barley. Herbicide: They can’t use dicotyledon herbicides due to the mixture (vetch is dicotyledon) No herbicides. Chemical Fertilization: Vetch is legume, N fertilizer will not be applied. Only one application before sowing: DAP (100kg per ha). Organic Fertilization: None. Pesticide: No pesticide (unless symptoms appear, applied when there is pest/diseases attack). Harvest: Cut before maturity (in May). Residue
Since it will be cut, roots will remain in the soil.
Seeds
150 kg per ha of seeds for sowing. Seeds will not be harvested.
Straw Yield
265 bales per ha (information from a farmer who implemented this AEP in the LL in 2025 together with intercropping, in olive garden).
Hypotheses and Scenarios
Hypothesis: Without reasonable prices of the seeds, farmers won’t adopt the forage mixture practice Scenario 1: Business as usual (BAU). Scenario 2: Forage mixture seeds available at 4 TND/kg. |
| Living Lab Scale | Baseline | ||
|---|---|---|---|
| RF1 (Small Scale Farm Type) | RF1 | ||
| Crop Pattern | Three different crops on 4,2 ha of farm area. | Three different crops on 82 ha of crop area. | Lorem ipsum |
| Land Use | Forage mixture (~3,1 ha), Fababean (~1,0 ha), Durum Wheat (~1.4 ha) | Formix (~60 ha), Chickpea (~14ha), Fababean (~8 ha) | Lorem ipsum |
| Pesticide Use | ~79 kg/year −74% decrease compared to baseline (~305 kg) | −73% compared to baseline (~1,904 kg vs. ~7,289 kg) | Lorem ipsum |
| Nitrogen Leaching | 0,07 kg/year (baseline 53,4 kg/year) | 0,5 kg/year (baseline 432 kg/year) | Lorem ipsum |
| Living Lab Scale | Baseline | ||
|---|---|---|---|
| RF1 (Small Scale Farm Type) | RF1 | ||
| Total Farm Income | ~$9513/year +69% increase compared to baseline (~$5,616) | ~$148,000/year +53% above baseline (~$97,000) | Lorem ipsum |
| Name | Intercropping |
| Résumé | In this scenario, we propose integrating an intercropping system between trees by including forage mixture practice. This scenario is expected to help enhance the land use efficiency by utilising the free space between the tree rows. Cultivated forage mixture, which includes legume crops, has different benefits for the soil, and it will be an additional income (depending on the production/ yield) for the farmers or feed for their livestock. Livestock existence is a condition for this scenario; the production will be used for the livestock (harvest every year, no green manure, etc.). This practice 51 D4.4 AEP scenarios and drivers is feasible when the space between the trees is sufficient (in an extensive way). In the LL, this practice is feasible mainly for olive gardens because the space between the lines is wide enough to implement intercropping. Usual forage species (oat or barley, but only one at a time) will be replaced by a forage mixture of two: vetch and oat, enhancing the nutritional quality of the forage. The mixture will be 75% vetch and 25% oat. Forage mixture will be used as cut feed, not for grazing. Seeds will be provided by the private sector - improved varieties. |
| Assumptions |
Usual forage species (oat or barley, but only one at a time) will be replaced by a forage mixture of %75 vetch and 25% oat to enhance the nutritional quality of the forage. The forage mixture will be used as cut feed, not grazing. Seeds will be provided by the private sector based on improved varieties. Information from the field: Livestock in the LL is mainly sheep, Farmers also use concentrate. There are problems in maintaining livestock due to the high cost of feed and drought seasons (they can’t cultivate forage crops during the drought seasons). |
| Technical details |
Yield
The yield level of trees may be increased after several years due to enhanced soil fertility. It’s not expected immediately, but after some years. Another advantage of this practice on yield is stability over the years.
Activities and Labour
Mechanization: Only sowing. Sowing: Will occur every year. Tillage: For soil preparation before sowing. Weeding: Weeding activities will be reduced. Herbicide: May decrease depending on abondance of weeds. Chemical Fertilization: After adopting this practice, we expect an increase in soil N content. Thus, the need for chemical N fertilization will be reduced. Organic Fertilization: Not mentioned in the database. Harvest: Will increase due to Olive harvest + forage mixture harvest. Residue
We will have residue from the forage mixture.
Seeds
For forage mixture: seed cost will increase, due to adoption of intercropping practice.
Straw Yield
No straw yield because the mixture of oat and vetch will be harvested as cut forage.
Hypotheses and Scenarios
Hypothesis: Introducing intercropping will enhance the economic viability of the farm, but without reasonable price of the seeds, farmers won’t be interested in this practice. Scenario 1: Business as usual (BAU). Scenario 2: Forage mixture seeds are available for 4 TND/kg, thus farmers start integrating intercropping with forage mixture |
| Living Lab Scale | Baseline | ||
|---|---|---|---|
| RF1 (Small Scale Farm Type) | RF1 | ||
| Crop Pattern | Five different crops grown across the farm on 4,2 ha of farm area. | Seven different crops grown across the farm on 60 ha of farm area. | Lorem ipsum |
| Land Use | Land use increases by 0,1 ha due to intercropping activity (total olive yard is 0,3ha) Forage mixture (~3,1 ha), Fababean (~1,0 ha), Durum Wheat (~1.4 ha) | Increase in the utilized land by 6 ha, (forage mixture added under the olive yards) Durum wheat (~29 ha), chickpea (~22 ha), fenugreek (~14 ha), oat (~7 ha), intercropping forage mixture (~6 ha) | Lorem ipsum |
| Pesticide Use | ~278 kg/year −8.8% decrease compared to baseline (~305 kg) | −21% compared to baseline (~5,745 kg vs. ~7,289 kg) | Lorem ipsum |
| Nitrogen Leaching | 53,9 kg/year/all farm (baseline 53,4 kg/year) | 518 kg/year/all farm (baseline 432 kg/year) | Lorem ipsum |
| Living Lab Scale | Baseline | ||
|---|---|---|---|
| RF1 (Small Scale Farm Type) | RF1 | ||
| Total Farm Income | ~$5,578/year almost same as baseline (~$5,616) | ~$139,000/year, +44% above baseline | Lorem ipsum |
| Name | Intercropping |
| Résumé |
The main objective of this AEP is to incorporate
legumes into the existing monoculture farming system. The proposed crop rotation will be established in
biannual rotation of cereals and legumes. Currently, the majority of the farmers rely on a monoculture production
system of durum wheat. Even if farmers practice fallow, the subsequent crop remains as cereals (durum wheat,
barley, oat). Although farmers may consider this practice as rotation, in agronomic terms it’s not a true crop
rotation. Crop Rotation Pattern: Year 1: Cereal (durum wheat or barley or oat) → Year 2: Legumes (faba bean) → Year 3: Cereal (durum wheat or barley or oat) |
| Assumptions | |
| Technical details |
Yield
The yield is expected to increase as a result of enhanced soil fertility, and reduced diseases particularly, fungal diseases. This effect will be observed after some years, not immediately. Another benefit of this practice is yield stability over the years, especially for cereals.
Activities and Labour
Mechanization: No change. Sowing: No change. Tillage: No change. Weeding: Weeding activities will be reduced here due to the legume crops’ advantage, which is a mechanical barrier for weeds . Herbicide: May be decrease due to abondance of weeds (see weeding). Chemical Fertilization: After adopting this practice soil N content level are expected to increase. As a result, the need for chemical N fertilization will be less. Organic Fertilization: Not mentioned in the database for cereals . Pesticide: Will decrease. In rotation the life cycle of pests and diseases is expected to break (both crops). Harvest: No change. Residue
Cereal Year: No change. Legume Year: Residue level will increase Seeds
For cereals: No change. For legumes: Seed costs will increase due to introduction of new crops in pattern. Legume seeds are more expensive than cereal seeds. Availability: Seed availability will be tested as solution to adopt the scenario. Straw Yield
For cereals: Will be increased. For legumes: No straw (it will be integrated into the soil, (as green fertilizer or after the harvest it will remain the soil as residue). Hypotheses and Scenarios
Hypothesis: Farmers won’t adopt legume crops in their rotation system unless there is market availability for legumes with good prices Scenario 1: Business as usual (BAU). Scenario 2: Legume crops are sold in 1,75 TND on the market |
| Living Lab Scale | Baseline | ||
|---|---|---|---|
| RF1 (Small Scale Farm Type) | RF1 | ||
| Crop Pattern | Four different crops on 4,2 ha of farm area. | Three different crops on 60 ha of farm area. | Lorem ipsum |
| Land Use | Durum Wheat Monoculture (~0,12 ha), Oat (~0,17 ha), Fababean (~0,9 ha), Durum Wheat Rotation (~0,86 ha), Legume Rotation (~ 0,86 ha) | Durum Wheat Monoculture (~1,51 ha), Oat (~9,61 ha), Chickpea (~22,23 ha), Fababean (~1,48 ha), Fenugreek (~8,46 ha), Durum Wheat Rotation (~18,2 ha), Legume Rotation (~ 18,2 ha) | Lorem ipsum |
| Pesticide Use | ~17,8 kg/year −66% decrease compared to baseline (~53kg)) | 3369 compared to baseline (~3369 kg vs. ~7,289 kg) | Lorem ipsum |
| Nitrogen Leaching | 15,9 kg/year, -70 decrease compared to baseline (53kg/year) | 232 kg/year, -46 decrease compared to baseline (432kg/year) | Lorem ipsum |
| Living Lab Scale | Baseline | ||
|---|---|---|---|
| RF1 (Small Scale Farm Type) | RF1 | ||
| Total Farm Income | ~$2942,714/year -47% decrease compared to baseline (~$5,616) | ~88127,6 USD/year, 8,88% below the baseline mean | Lorem ipsum |
Lorem ipsum dolor sit amet, consectetur adipiscing elit. Ut blandit justo a commodo rutrum. Suspendisse ornare turpis eget cursus varius. In id fermentum mi. Aenean porta sodales sapien, id consectetur dui egestas vel. Donec quis accumsan mauris, nec consectetur erat. Integer eu ipsum nec lectus ultricies dictum.